Radius Strategy Flow Chart

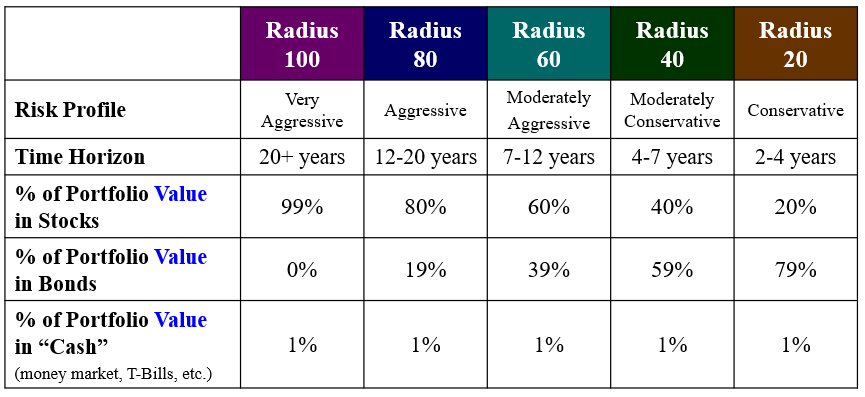
For the Radius Strategy, we offer five primary portfolio configurations to meet the diverse risk tolerance and time horizon needs of our clients:

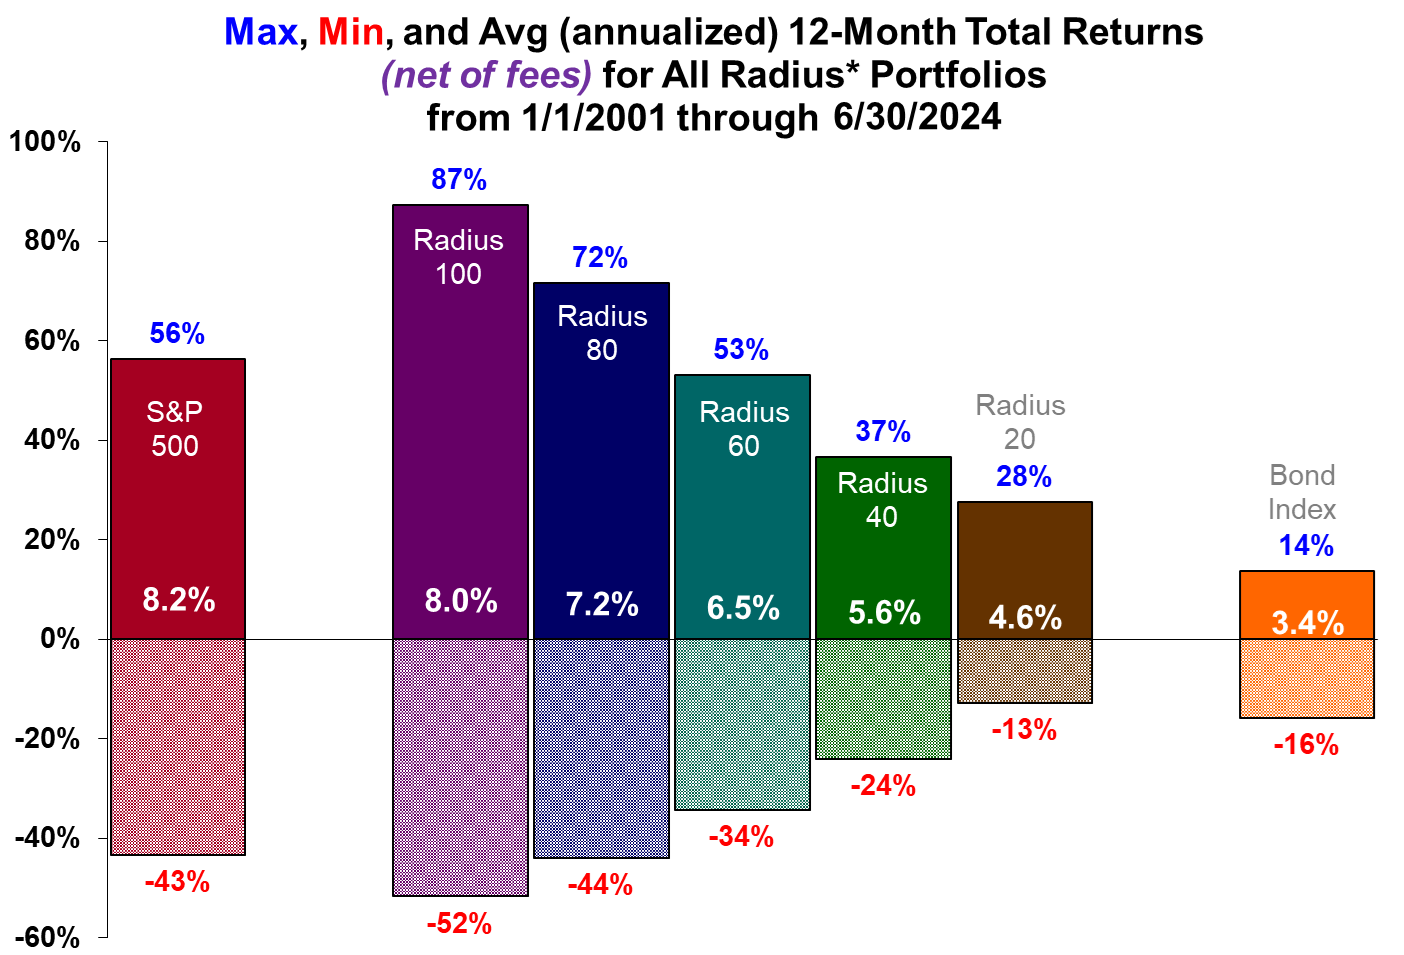
Performance Numbers: Best, Worst, and Average 12-Month Returns

Comments/Disclosures on Performance Numbers:
Past performance is no guarantee of future results. It should not be assumed that investment decisions made in the future will be profitable or will equal the performance of the portfolios shown above.
* Total return numbers for the Radius 100 and Radius 60 portfolios reflect the (unaudited) performance of actual portfolios that have been invested since 1/1/2001. All data prior to 3/30/2003 for the Radius 40 and 20 Portfolios are based on actual returns from the Radius 100 and 60.
All performance numbers include dividends and capital gains and are reported net of all transaction costs and management fees.
